Saudi Arabia is a USD 760 Billion economy. The country is home to 34 million residents , with a high consumption potential. The GDP of the country has shown a significant growth from USD 645 Billion in 2016 to USD 793 Trillion in 2019. On an average, the final consumption of the country accounts for around 66% of the GDP whereas the household consumption accounts for around 27% of the GDP, indicating a potential consumer goods market, The population constitutes of ~5 million of NRIs and PIOs, indicating a vast Indian diaspora.
Saudi Arabia is a USD 137 Bn import market, which is largely serviced by exporters from US and China. Saudi Arabia’s imports have grown from USD 130 Billion in 2016 to USD 144 Billion in 2019. It had seen a drop to USD 131 Billion in 2020 due to the outbreak of the COVID, that led to disrupted global supply chains.
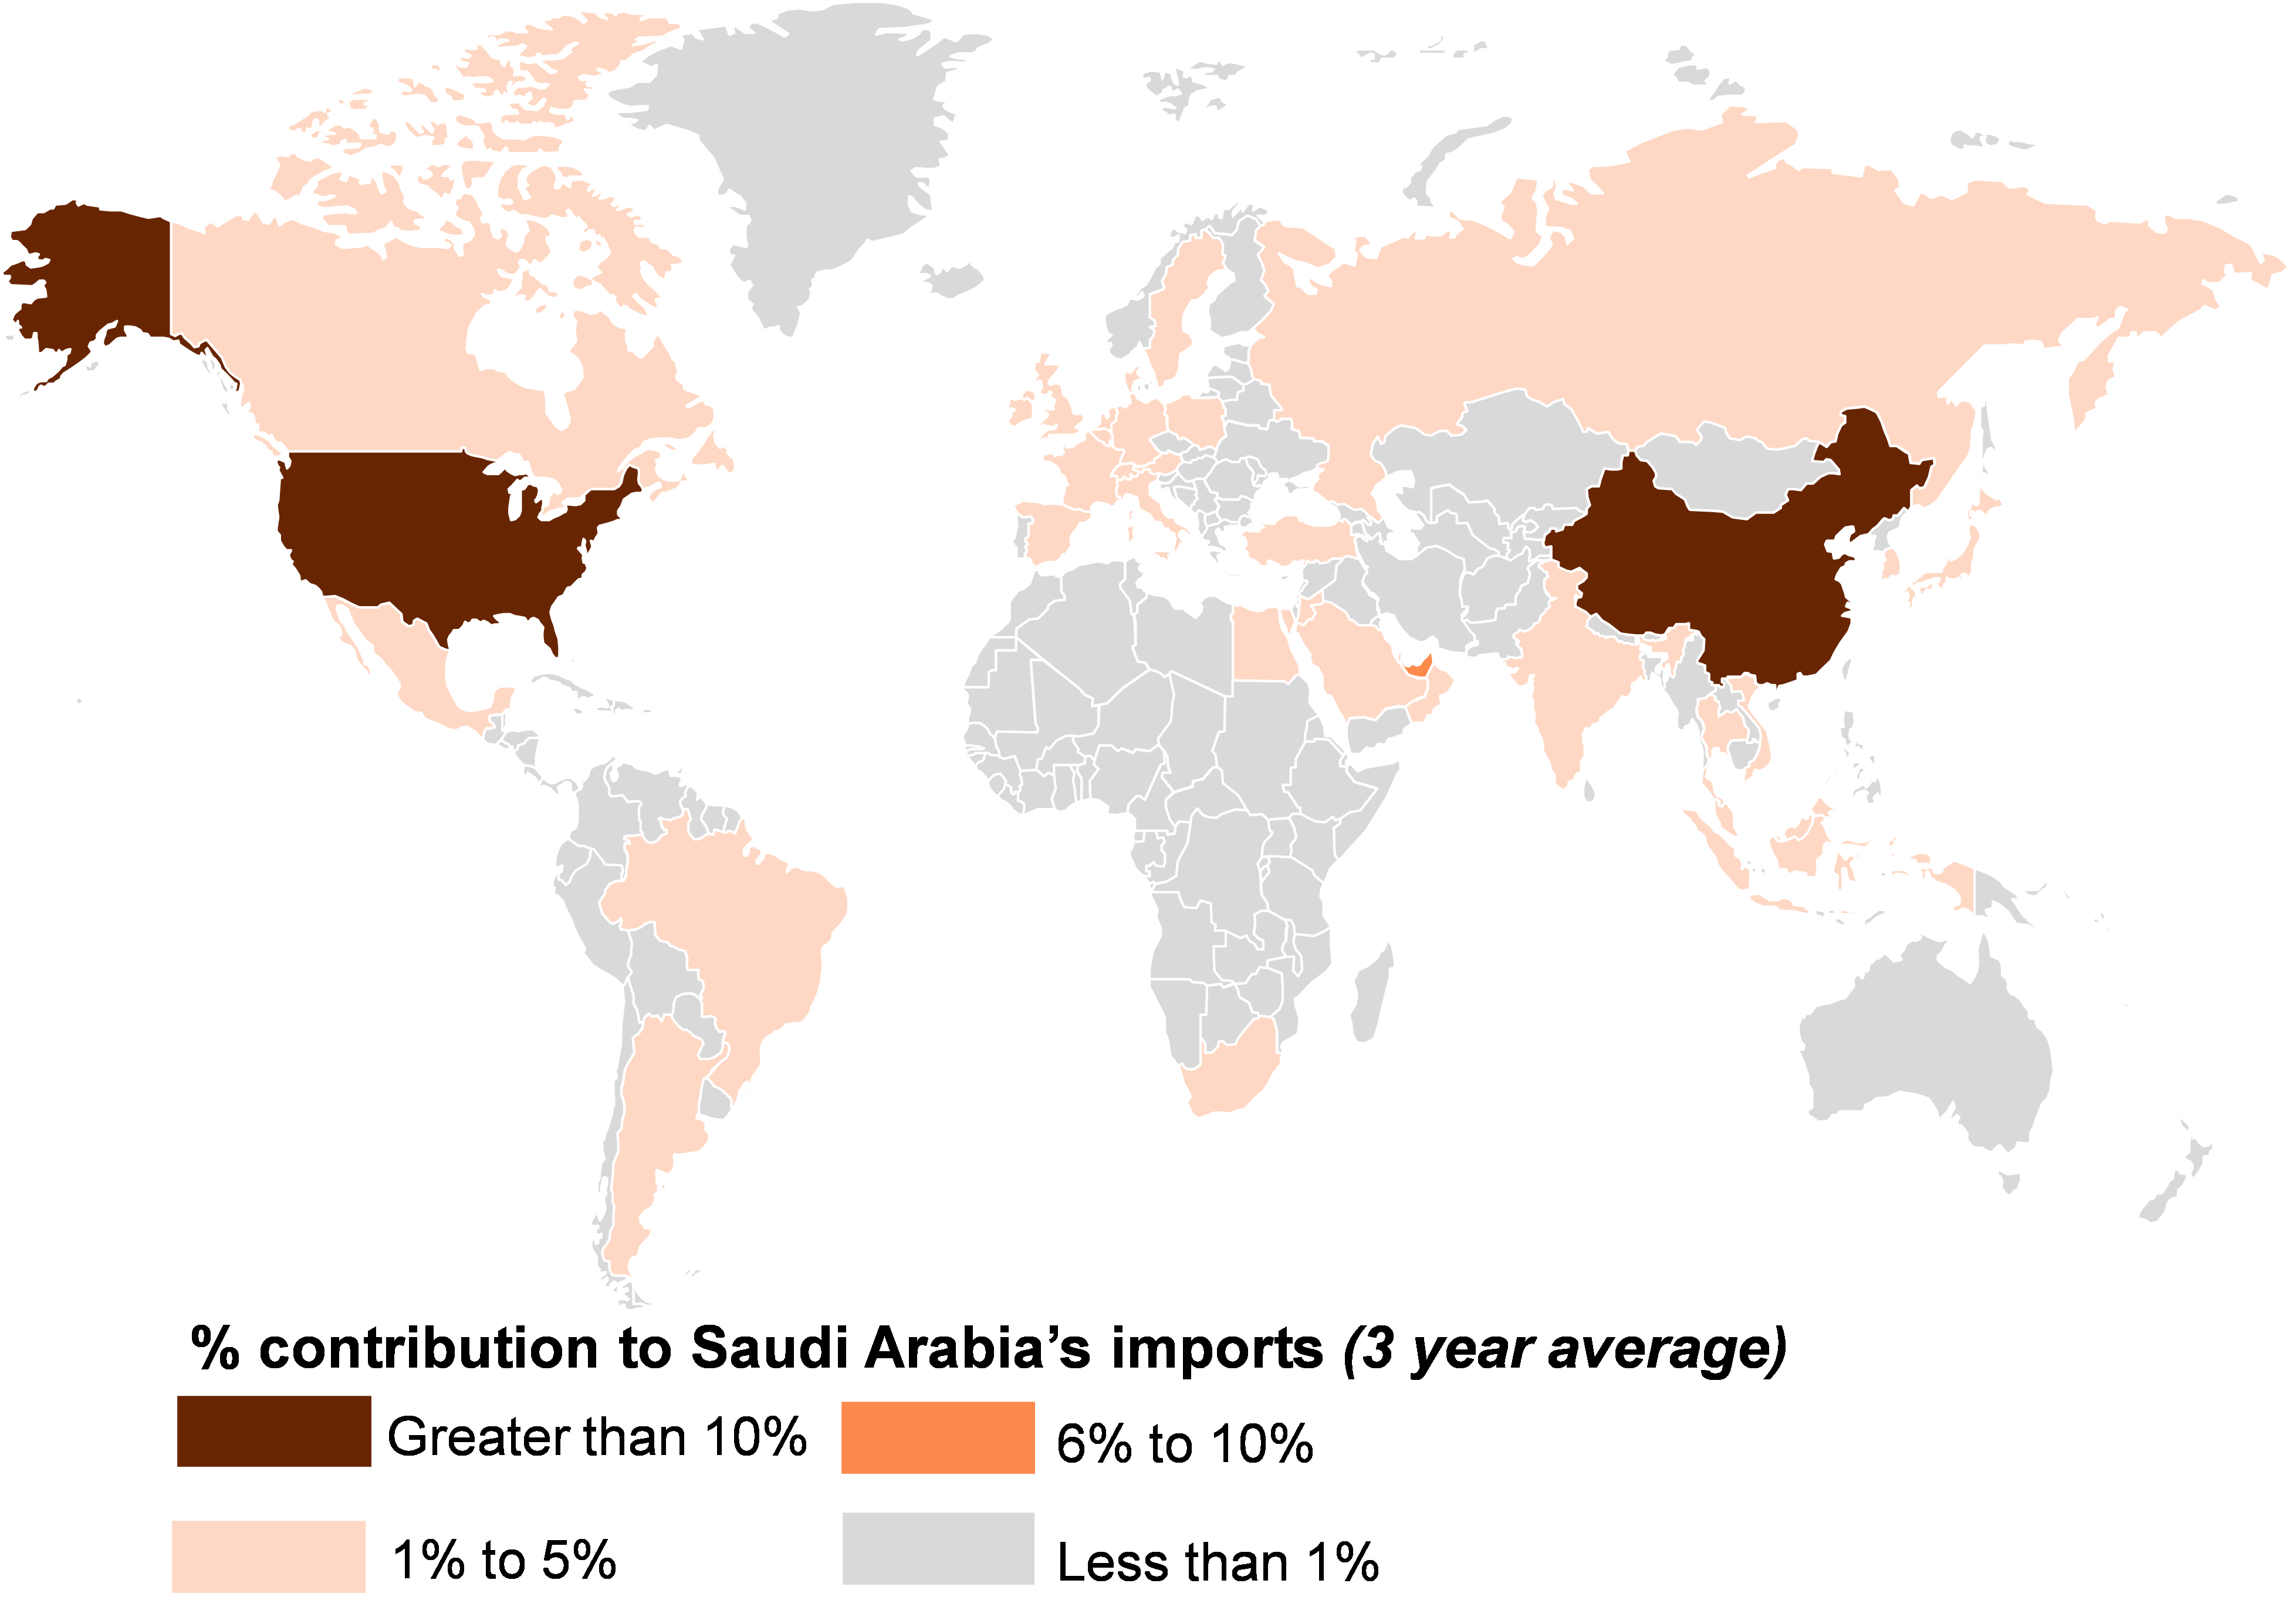
China is the largest exporters to the Arabian market with 18% of the total imports by Saudi Arabia. It is followed by USA that accounts for 12% of the total imports. The top 10 countries contributing approximately 64% of imports to other than US and China are UAE, Germany, India, Japan, France, Italy, South Korea and UK. India is the 5th largest exporter to Saudi Arabia. On an average, India contributes to 4.3% of Saudi Arabia’s imports. A detailed list of key countries exporting to Saudi Arabia is attached in annexure 01.
Saudi Arabia in general imports USD 137 Billion worth of products on an average basis. Of that the leading sectors that contribute to 62% of Saudi Arabia’s imports are Machinery & equipment, Vehicles & auto-components, Electricals & electronics, mineral fuels, pharmaceuticals, gems and jewelry, Iron and steel articles, Plastics & its articles, ships and boats, and Optical, photographic & Cinematographic devices.

| Table 1: Top service contributing to imports of Saudi Arabia | ||||||
|---|---|---|---|---|---|---|
| Code | Service Label | Imported value in 2018 | Imported value in 2019 | Imported value in 2020 | 3 year average | % share |
| 'TOTAL | All Service | 93718 | 89211 | 63275 | 82068 | 1 |
| 12 | Government goods and services n.i.e. | 28869 | 23441 | 15682 | 22664 | 0.28 |
| SOX1 | Memo item: Other commercial services | 22718 | 22404 | 14794 | 19972 | 0.24 |
| 3a.2 | Freight transport, All modes (alternative breakdown) | 13323 | 14887 | 13413 | 13875 | 0.17 |
| 4 | Travel | 16651 | 15140 | 8533 | 13441 | 0.16 |
| 5 | Construction | 6407 | 7053 | 6452 | 6637 | 0.08 |
| 6 | Insurance and pension services | 1645 | 1781 | 1594 | 1673 | 0.02 |
| 9 | Telecommunications, computer, and information services | 1714 | 1718 | 1346 | 1593 | 0.02 |
| 3a.31 | Other transport, All modes (other than passenger and freight, postal and courier) (alternative breakdown) | 1103 | 1512 | 925 | 1180 | 0.01 |
| 3a.1 | Passenger transport, All modes (alternative breakdown) | 1288 | 1275 | 536 | 1033 | 0.01 |
| Total | 93718 | 89211 | 63275 | 82068 | 1 | |
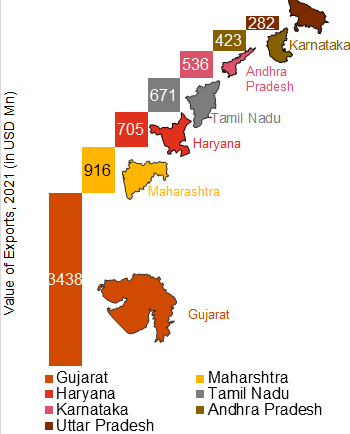
India exports an average of USD 6 Billion worth of goods to Saudi Arabia per year. India’s share in the country’s imports have increased from 3.8% in 2016 to 4.8% in 2020. Gujarat, Maharashtra, Haryana, Tamil Nadu, Andhra Pradesh, Karnataka and Uttar Pradesh are the top 7 states of India in terms of exports to Saudi Arabia in 2021, contributing approximately 85% of India’s exports to Saudi Arabia.
India’s exports to Saudi Arabia are characterized by exports of the following top 10 sectors: Mineral fuels & oils, iron and steel, ceramic products, meat, machinery, apparels & textiles, electricals & electronics, footwear, vehicles & auto-components, organic chemicals, aircrafts etc. as shown in table below. The table also discusses the percentage share of the sector in India’s exports to Saudi Arabia and the contribution of India’s exports in Saudi Arabia’s total imports of that sector at a HS 2 level. The sectors highlighted in yellow are the key sectors identified for driving exports growth from Uttar Pradesh.
| Table 2: Top sectors contributing to 60% of India’s exports to Saudi Arabia | ||||||||
|---|---|---|---|---|---|---|---|---|
| Sector | India’s exports to Saudi Arabia, (USD Mn) | % share of sector in India’s exports globally | % share of India’s exports to Saudi Arabia’s imports | |||||
| HS 27, Mineral fuels | 1017 | 0.012 | 0.17 | |||||
| HS 10, Cereal | 900 | 0.028 | 0.15 | |||||
| HS 29, Organic Chemicals | 609 | 0.057 | 0.1 | |||||
| HS 87, Vehicles & Auto-components | 507 | 0.049 | 0.08 | |||||
| HS 61 & 62, Apparels | 376 | 0.044 | 0.07 | |||||
| HS 72 & 73, Iron and Steel | 324 | 0.065 | 0.05 | |||||
| HS 84, Machinery & Equipment | 307 | 0.064 | 0.05 | |||||
| HS 69, Ceramic products | 211 | 0.006 | 0.04 | |||||
| HS 85, Electricals & Electronics | 156 | 0.047 | 0.03 | |||||
| HS 02, Meat and edible meat offal | 114 | 0.01 | 0.02 | |||||
| Total exports (3 year average) | USD 6 Bn | |||||||
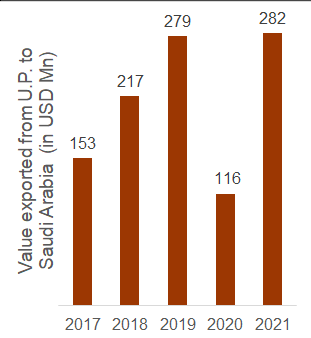
The exports from Uttar Pradesh to Saudi Arabia grew at a CAGR of 4% in the last 5 years. Uttar Pradesh exported a total of USD 282 Million value of commodities to Saudi Arabia in 2021 which grew from USD 153 Million in 2017. The exports from UP to Saudi Arabia accelerated by approximately 143% in 2021, indicating a high potential for growth in the future.
12 select sectors contributed to approximately 84% of UP’s exports to Saudi Arabia during the last 3 years. These are the sectors that have the highest export percentage that other products that are being imported by Saudi Arabia from UP. The table below summarizes the top 12 products exported from UP to Saudi Arabia:
| HS code | Product description | Value of Exports by UP (in USD Mn) | % share in UP’s exports to Saudi Arabia | Growth rate of exports from UP to Saudi Arabia | Growth rate of exports from UP to all markets |
|---|---|---|---|---|---|
| 02 | Meat and edible meat offal | 1,654 | 30% | 4% | -2.1% |
| 61 & 62 | Apparels | 1,597 | 13% | -40% | -4.8% |
| 17 | Sugar and sugar confectionery | 355 | 10% | 13% | 47.5% |
| 73 & 72 | Iron and Steel Articles | 736 | 6% | -3% | 50.6% |
| 84 | Machinery & Equipment | 611 | 6% | -21% | 9% |
| 42 & 64 | Leather and footwears | 1,044 | 5% | -38% | 2% |
| 10 | Cereals | 436 | 3% | -20% | 38.6% |
| 74 | Copper and articles thereof | 124 | 3% | -17% | 11.7% |
| 57 | Carpets and other floor coverings | 547 | 2% | -50% | 9.5% |
| 76 | Aluminium and articles thereof | 556 | 2% | 27% | 8.2% |
| 94 | Furnitures | 347 | 2% | 56% | 36.8% |
| 85 | Electricals & Electronics | 2,774 | 2% | -19% | 9.4% |
Select sectors are identified as potential opportunities which may drive growth of exports from Uttar Pradesh to Saudi Arabia. The sectors are selected based on the import demand in Saudi Arabia, India’s exports to Saudi Arabia and UP’s exports to Saudi Arabia. The priority sectors shortlisted are classified into two categories, based on the relevant strategy for export promotion. The sectors with significant manufacturing and exports volume to Saudi Arabia are strategically selected for scaling up of exports. The sectors with appreciable manufacturing volume, but low level of exports from UP to Saudi Arabia are selected for market diversification into Saudi Arabia.
The table below summarizes the top 10 sectors shortlisted for UP’s exporters who intend to undertake exports in Saudi Arabia. A comprehensive detail for the select 10 sectors at a HS 6 level is described in annexure 3.
| Potential sectors for driving UP’s exports growth in Saudi Arabia | |||||
|---|---|---|---|---|---|
| HS Code | Product Description | Value imported by Saudi Arabia (USD Mn) | Exports from India to Saudi Arabia (USD Mn) | UP’s exports to Saudi Arabia (USD Mn) | Potential intervention strategy |
| 84 | Machinery & Equipment | 15917 | 271.2 | 12.2 | Scaling up |
| 87 | Vehicles & Auto-components | 13645 | 454.5 | 1.1 | Diversification |
| 85 | Electrical & Electronics | 13585 | 171.4 | 3.2 | Diversification |
| 72 & 73 | Iron and Steel articles | 7642 | 286.3 | 10.3 | Scaling up |
| 39 | Plastics and articles | 3225 | 87 | 2.1 | Diversification |
| 71 | Gems and Jewelry | 3174 | 38 | 1.2 | Diversification |
| 10 | Cereals | 2972 | 971.2 | 13.3 | Scaling up |
| 94 | Furnitures | 2269 | 16.5 | 2.6 | Diversification |
| 61 & 62 | Apparels | 3351 | 365.6 | 28.9 | Scaling up |
| 42 & 64 | Leather and Footwear | 1261 | 31.3 | 11.8 | Scaling up |
| 57 | Carpets & floor coverings | 468.3 | 8.7 | 5.1 | Diversification |
| 70 | Glass and glassware | 394.7 | 8.5 | 1.6 | Diversification |
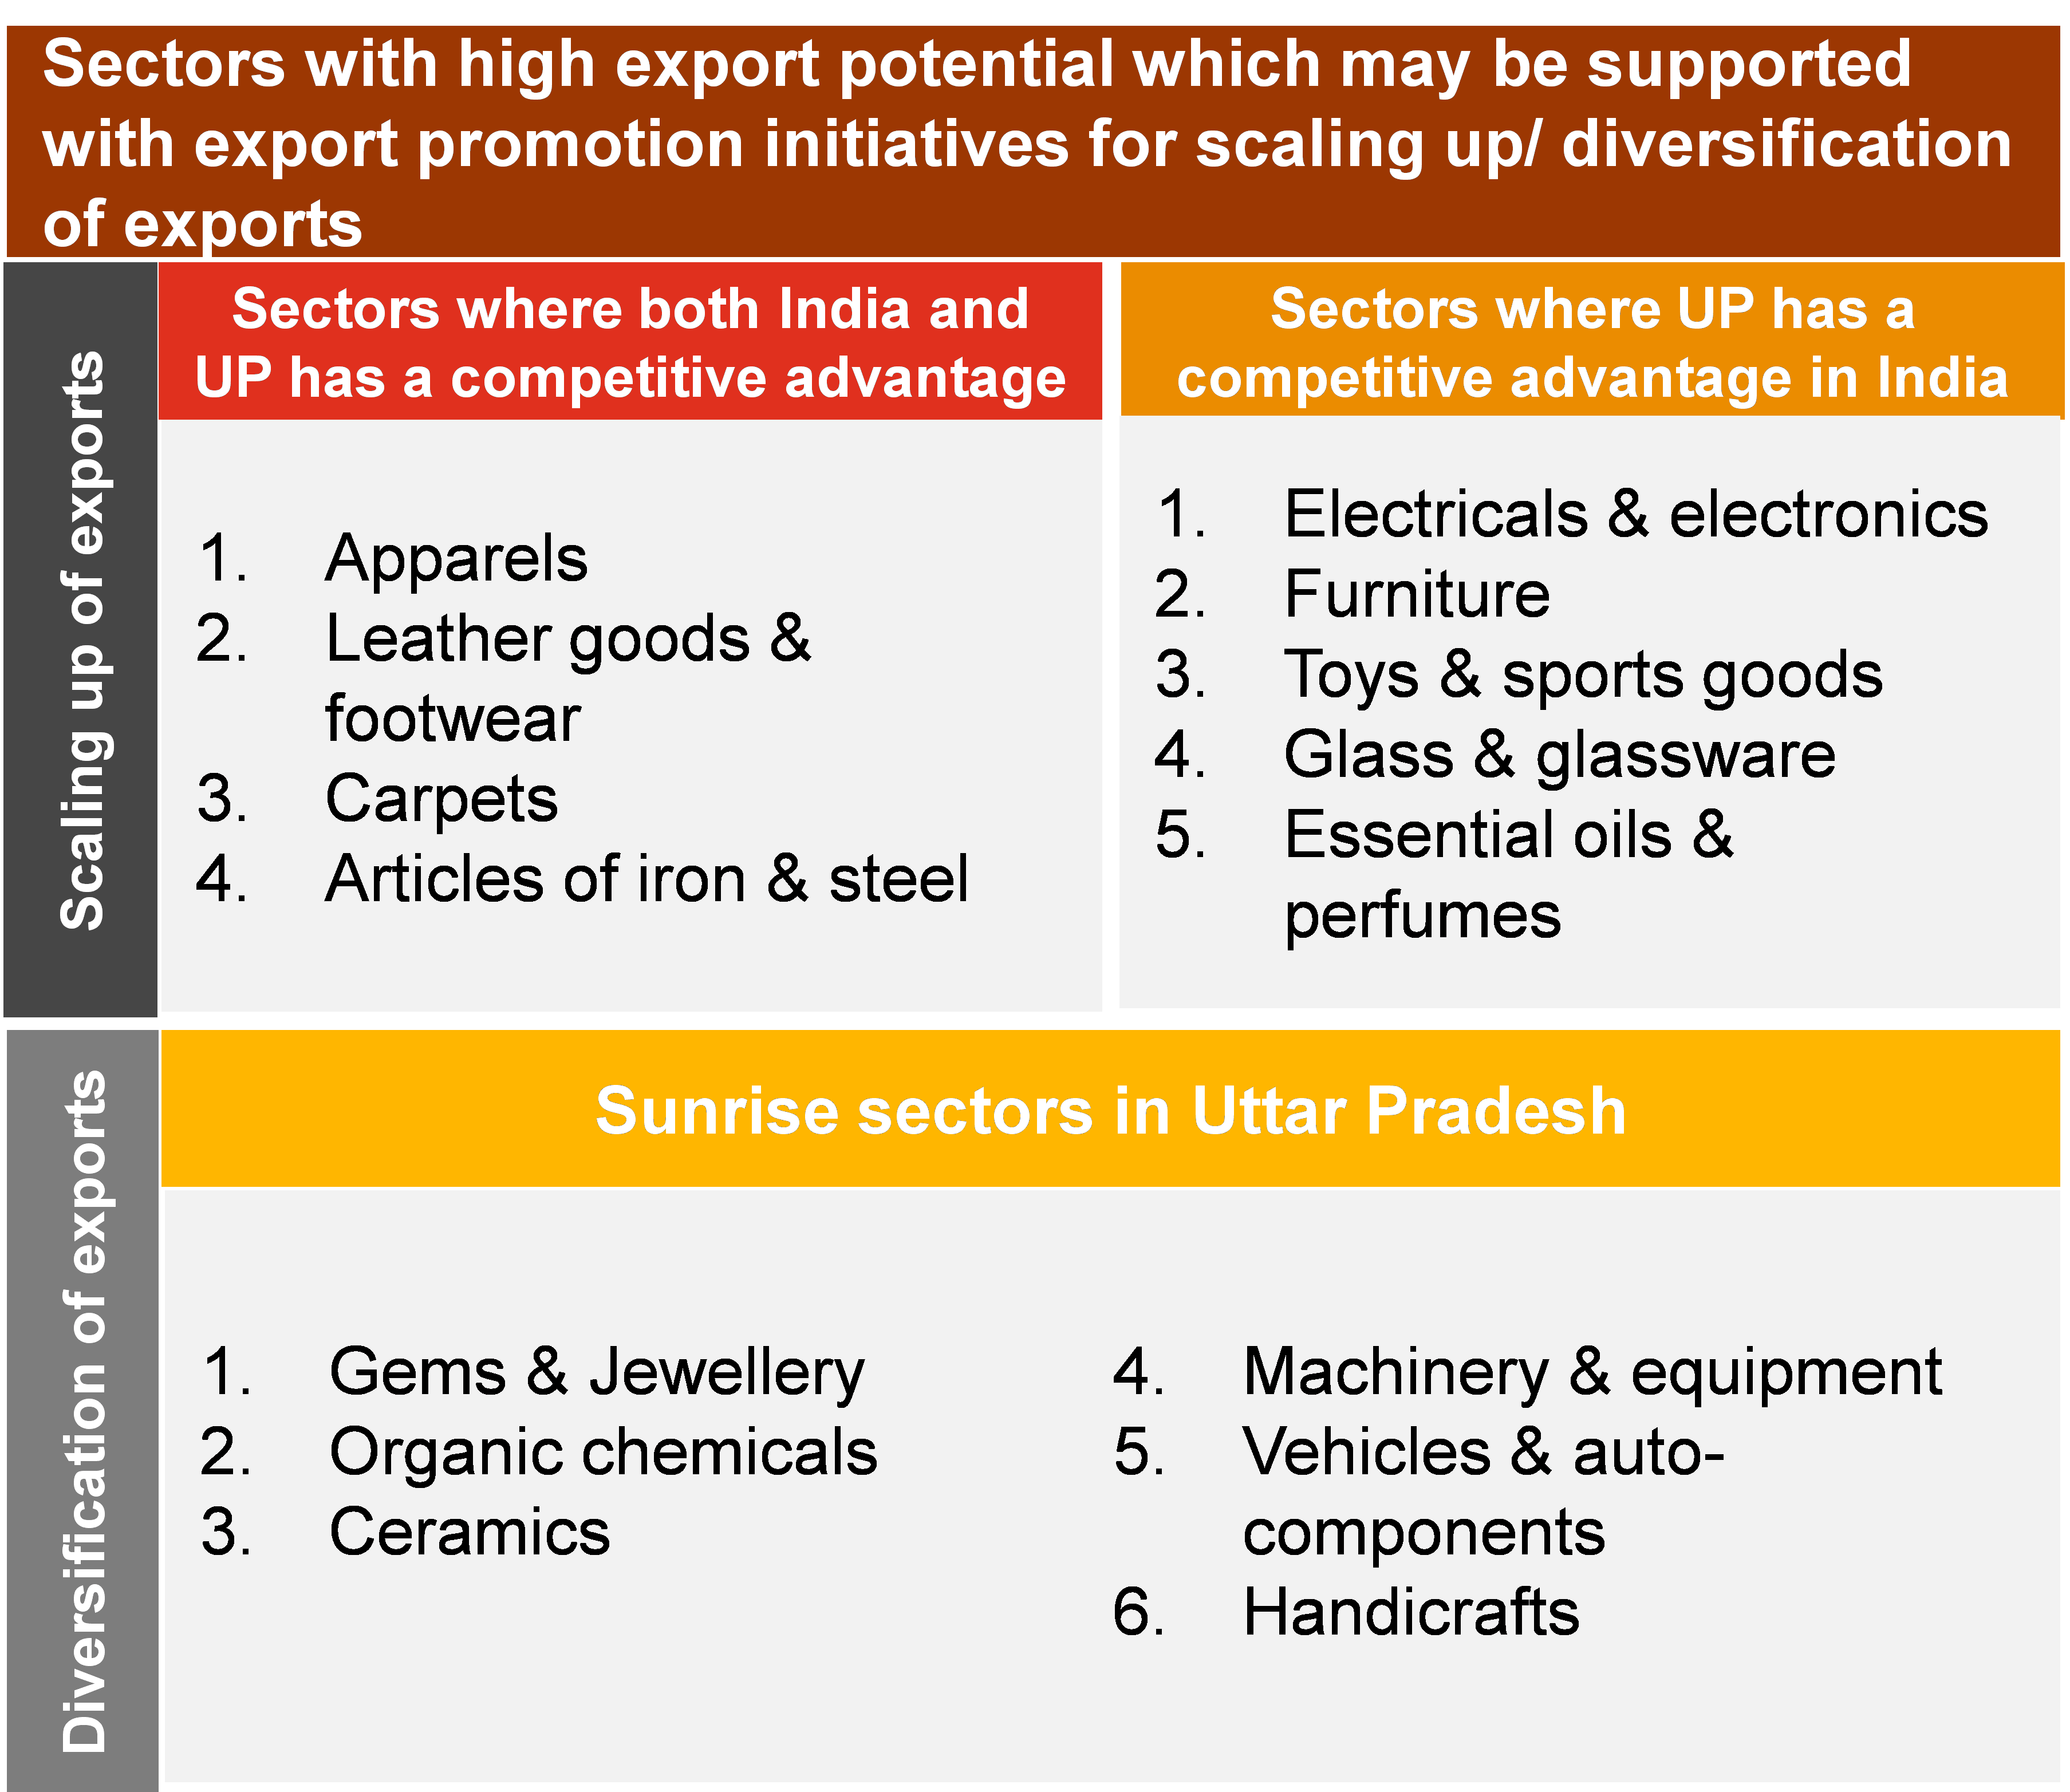
Uttar Pradesh’s export capabilities in select sectors resonates with the consumer demands in Saudi Arabia. At a global level, the priority sectors are classified on based on their RCA scores to identify the relevant export promotion strategies. The traditional sectors for which UP has a competitive advantage are selected for scaling up globally. Similarly, the sunrise sectors are selected for product development and market diversification to boost exports as shown in Figure 5. Also, the state government has shortlisted products with a high export potential for each district of the state under the ‘Districts as Export Hubs’ initiative.
At a country level, the export trends are analyzed to identify country level strategies for export promotion as described in table 3. Further, to support exporters of the state in scaling of exports, the government of Uttar Pradesh through Export Promotion Bureau – Uttar Pradesh and Uttar Pradesh Export Promotion Council has planned to undertake the following initiatives: 1. Identifying and connecting with Sectoral bodies (for priority sectors) based in Saudi Arabia 2. Identifying importers and their sourcing needs 3. List of key events where UP's exporters shall participate 4. Facilitate visit of Saudi Arabia’s importers to UP in key trade events that may be organized by Government of Uttar Pradesh 5. Identification of online platforms where UP's exporters should register for exporting their products to meet sourcing requirements of the market demand.
| Exporters | Imported value in 2018 | Imported value in 2019 | Imported value in 2020 | 3 year average | % share |
|---|---|---|---|---|---|
| Total | 135,211 | 144,335 | 131,329 | 136,958 | 100% |
| China | 22,244 | 27,067 | 26,509 | 25,273 | 50% |
| United States of America | 18,041 | 17,097 | 14,104 | 16,414 | 13% |
| United Arab Emirates | 12,080 | 10,365 | 8,980 | 10,475 | 6% |
| Germany | 7,292 | 7,004 | 6,809 | 7,035 | 3% |
| India | 5,685 | 6,489 | 6,367 | 6,180 | 3% |
| Japan | 5,474 | 6,546 | 5,662 | 5,894 | 2% |
| France | 4,588 | 5,028 | 4,062 | 4,559 | 2% |
| Italy | 4,236 | 4,310 | 4,080 | 4,209 | 2% |
| Korea, Republic of | 4,300 | 4,027 | 3,821 | 4,050 | 1% |
| United Kingdom | 3,124 | 3,085 | 3,007 | 3,072 | 1% |
| Turkey | 2,658 | 2,981 | 1,992 | 2,544 | 1% |
| Brazil | 2,310 | 2,239 | 2,156 | 2,235 | 1% |
| Spain | 2,463 | 2,060 | 2,125 | 2,216 | 1% |
| Thailand | 1,993 | 2,419 | 2,216 | 2,209 | 1% |
| Egypt | 1,494 | 2,396 | 2,628 | 2,173 | 1% |
| Canada | 1,714 | 2,229 | 1,832 | 1,925 | 1% |
| Netherlands | 1,867 | 2,154 | 1,707 | 1,909 | 1% |
| Indonesia | 1,578 | 2,163 | 1,752 | 1,831 | 1% |
| Oman | 1,780 | 1,884 | 1,652 | 1,772 | 1% |
| Switzerland | 1,926 | 1,703 | 1,484 | 1,704 | 1% |
| Others | 26,810 | 29,377 | 26,582 | 27,589 | 20% |
| HS Code | Product Description | Imported value in 2018 | Imported value in 2019 | Imported value in 2020 | 3 year average | % share |
|---|---|---|---|---|---|---|
| 'TOTAL | All products | 135,211 | 144,335 | 131,329 | 136,958 | 100% |
| '84 | Machinery, mechanical appliances, nuclear reactors, boilers; parts thereof | 15,470 | 16,848 | 15,432 | 15,917 | 12% |
| '87 | Vehicles other than railway or tramway rolling stock, and parts and accessories thereof | 11,873 | 14,969 | 14,092 | 13,645 | 10% |
| '85 | Electrical machinery and equipment and parts thereof; sound recorders and reproducers, television image and sound recorders and reproducers, and parts and accessories of such articles | 13,677 | 14,364 | 12,716 | 13,585 | 10% |
| '99 | Commodities not elsewhere specified | 8,521 | 8,641 | 6,554 | 7,905 | 6% |
| '30 | Pharmaceutical products | 5,534 | 5,309 | 5,615 | 5,486 | 4% |
| '27 | Mineral fuels, mineral oils and products of their distillation; bituminous substances; mineral waxes | 3,975 | 3,891 | 4,358 | 4,075 | 3% |
| '89 | Ships, boats and floating structures | 4,338 | 5,492 | 2,227 | 4,019 | 3% |
| '72 | Iron and steel | 3,153 | 4,165 | 4,488 | 3,935 | 3% |
| '73 | Articles of iron or steel | 3,945 | 3,796 | 3,378 | 3,706 | 3% |
| '90 | Optical, photographic, cinematographic, measuring, checking, precision, medical or surgical instruments and apparatus; parts and accessories thereof | 3,565 | 3,765 | 3,742 | 3,691 | 3% |
| '39 | Plastics and articles thereof | 3,088 | 3,307 | 3,282 | 3,225 | 2% |
| '71 | Natural or cultured pearls, precious or semi-precious stones, precious metals, metals clad with precious metal, and articles thereof; imitation jewellery; coin | 4,065 | 3,559 | 1,900 | 3,174 | 2% |
| '10 | Cereals | 3,219 | 2,811 | 2,888 | 2,972 | 2% |
| '88 | Aircraft, spacecraft, and parts thereof | 2,543 | 2,797 | 2,249 | 2,530 | 2% |
| '94 | Furniture; bedding, mattresses, mattress supports, cushions and similar stuffed furnishings; lamps and lighting fittings, not elsewhere specified or included; illuminated signs, illuminated nameplates and the like; prefabricated buildings | 2,121 | 2,352 | 2,335 | 2,269 | 2% |
| '04 | Dairy produce; birds' eggs; natural honey; edible products of animal origin, not elsewhere specified or included | 1,883 | 1,922 | 2,225 | 2,010 | 1% |
| '38 | Miscellaneous chemical products | 1,858 | 2,054 | 1,997 | 1,970 | 1% |
| '29 | Organic chemicals | 2,111 | 1,974 | 1,780 | 1,955 | 1% |
| '33 | Essential oils and resinoids; perfumery, cosmetic or toilet preparations | 1,828 | 2,137 | 1,882 | 1,949 | 1% |
| '02 | Meat and edible meat offal | 1,843 | 1,939 | 1,802 | 1,862 | 1% |
| '62 | Articles of apparel and clothing accessories, not knitted or crocheted | 1,746 | 2,220 | 1,572 | 1,846 | 1% |
| '74 | Copper and articles thereof | 1,839 | 1,848 | 1,765 | 1,817 | 1% |
| '40 | Rubber and articles thereof | 1,542 | 2,061 | 1,777 | 1,793 | 1% |
| '08 | Edible fruit and nuts; peel of citrus fruit or melons | 1,577 | 1,623 | 1,754 | 1,651 | 1% |
| '48 | Paper and paperboard; articles of paper pulp, of paper or of paperboard | 1,655 | 1,629 | 1,481 | 1,588 | 1% |
| '61 | Articles of apparel and clothing accessories, knitted or crocheted | 1,429 | 1,640 | 1,447 | 1,505 | 1% |
| '19 | Preparations of cereals, flour, starch or milk; pastrycooks' products | 1,409 | 1,531 | 1,566 | 1,502 | 1% |
| '76 | Aluminium and articles thereof | 1,329 | 1,374 | 1,656 | 1,453 | 1% |
| '21 | Miscellaneous edible preparations | 1,328 | 1,352 | 1,380 | 1,353 | 1% |
| Others | 22,749 | 22,964 | 21,991 | 22,568 | 16% |
| HS Code (6 digit) | Product Description | Share in Saudi Arabia’s import at the HS 2 level | Average share in global imports at HS2 level | Global exports by India | India’s share in global exports | Global exports by Uttar Pradesh |
|---|---|---|---|---|---|---|
| HS 84 – Machinery, mechanical appliances and equipment | ||||||
| '848180 | Appliances for pipes, boiler shells, tanks, vats or the like (excluding pressure-reducing valves, valves for the control of pneumatic power transmission, check "non-return" valves and safety or relief valves) | 6% | 2.4% | 806.4 | 2% | 15 |
| '847130 | Data-processing machines, automatic, portable, weighing <= 10 kg, consisting of at least a central processing unit, a keyboard and a display (excluding peripheral units) | 5% | 6.9% | 48.8 | 0% | 8.3 |
| '841510 | "Window or wall air conditioning machines, self-contained or ""split-system""" | 5% | 0.7% | 44.6 | 0% | 3.6 |
| '843143 | Parts for boring or sinking machinery of subheading 8430.41 or 8430.49, n.e.s. | 4% | 0.4% | 163.6 | 1% | 2.5 |
| '840710 | Spark-ignition reciprocating or rotary internal combustion piston engine, for aircraft | 4% | 0.2% | 219.2 | 5% | 7.8 |
| '847150 | Processing units for automatic data-processing machines, whether or not containing in the same housing one or two of the following types of unit: storage units, input units, output units (excluding those of heading 8471.41 or 8471.49 and excluding peripheral units) | 3% | 3.6% | 45.0 | 0% | 0.5 |
| '841199 | Parts of gas turbines, n.e.s. | 2% | 0.9% | 78.0 | 0% | 0.7 |
| '841391 | Parts of pumps for liquids, n.e.s. | 2% | 0.7% | 347.2 | 2% | 7.8 |
| '843049 | Boring or sinking machinery for boring earth or extracting minerals or ores, not self-propelled and not hydraulic (excluding tunnelling machinery and hand-operated tools) | 2% | 0.1% | 34.3 | 2% | 0.03 |
| '848190 | Parts of valves and similar articles for pipes, boiler shells, tanks, vats or the like, n.e.s. | 2% | 0.8% | 440.3 | 3% | 3.8 |
| Total of 10 commodity | 34% | 2,227.3 | 50.03 | |||
| Rest of the commodities under HS code 84 | 66% | 17,673.7 | 579.67 | |||
| HS 87 - Vehicles & Auto-components | ||||||
| '870321 | Motor cars and other motor vehicles principally designed for the transport of persons, incl. station wagons and racing cars, with spark-ignition internal combustion reciprocating piston engine of a cylinder capacity <= 1.000 cm³ (excluding vehicles for the transport of persons on snow and other specially designed vehicles of subheading 8703.10) | 28% | 3% | 1404.2 | 4% | 0.2 |
| '870322 | Motor cars and other motor vehicles principally designed for the transport of persons, incl. station wagons and racing cars, with spark-ignition internal combustion reciprocating piston engine of a cylinder capacity > 1.000 cm³ but <= 1.500 cm³ (excluding vehicles for the transport of persons on snow and other specially designed vehicles of subheading 8703.10) | 27% | 8% | 2795.5 | 3% | 8.3 |
| '870323 | Motor cars and other motor vehicles principally designed for the transport of persons, incl. station wagons and racing cars, with spark-ignition internal combustion reciprocating piston engine of a cylinder capacity > 1.500 cm³ but <= 3.000 cm³ (excluding vehicles for the transport of persons on snow and other specially designed vehicles of subheading 8703.10) | 11% | 18% | 1767.6 | 1% | 0.2 |
| Total of top 3 commodities | 66% | 5967.3 | 8.7 | |||
| Rest of the commodities under HS code 87 | 34% | 10,261.7 | 498.2 | |||
| HS 85 - Electrical & Electronics | ||||||
| '851712 | "Telephones for cellular networks ""mobile telephones"" or for other wireless networks" | 34% | 10% | 2496.4 | 0.9% | 1751 |
| '851762 | Machines for the reception, conversion and transmission or regeneration of voice, images or other data, incl. switching and routing apparatus (excluding telephone sets, telephones for cellular networks or for other wireless networks) | 12% | 6% | 568.5 | 0.4% | 4.8 |
| '852610 | Radar apparatus | 2% | 0.2% | 21.4 | 0.3% | 0.4 |
| '853710 | Boards, cabinets and similar combinations of apparatus for electric control or the distribution of electricity, for a voltage <= 1.000 V | 2% | 2% | 412.5 | 0.7% | 16.2 |
| '852873 | Reception apparatus for television, black and white or other monochrome, whether or not incorporating radio-broadcast receivers or sound or video recording or reproducing apparatus, designed to incorporate a video display or screen | 2% | 0.01% | 12.8 | 22.4% | 0.04 |
| '851770 | Parts of telephone sets, telephones for cellular networks or for other wireless networks and of other apparatus for the transmission or reception of voice, images or other data, n.e.s. | 2% | 4% | 288.1 | 0.2% | 70.7 |
| '850710 | "Lead-acid accumulators of a kind used for starting piston engine ""starter batteries"" (excluding spent)" | 1% | 0.4% | 154.9 | 1.4% | 0.8 |
| '852872 | Reception apparatus for television, colour, whether or not incorporating radio-broadcast receivers or sound or video recording or reproducing apparatus, designed to incorporate a video display or screen | 1% | 2% | 7.3 | 0.0% | 0.7 |
| '852580 | Television cameras, digital cameras and video camera recorders | 1% | 1% | 69.9 | 0.2% | 11.8 |
| '850440 | Static converters | 1% | 2% | 995.3 | 1.6% | 13 |
| Total of top 10 commodities | 57% | 5027.1 | 1869.4 | |||
| Rest of the commodities under HS code 85 | 43% | 8397.9 | 543.6 | |||
| HS 72 & 73 – Iron and Steel Articles | ||||||
| '720310 | Ferrous products obtained by direct reduction of iron ore, in lumps, pellets or similar forms | 13% | 1% | 206.8 | 6% | 0 |
| '730890 | Structures and parts of structures, of iron or steel, n.e.s. (excluding bridges and bridge-sections, towers and lattice masts, doors and windows and their frames, thresholds for doors, props and similar equipment for scaffolding, shuttering, propping or pit-propping) | 5% | 5% | 482.9 | 1% | 13.4 |
| '720839 | Flat-rolled products of iron or non-alloy steel, of a width of >= 600 mm, in coils, simply hot-rolled, not clad, plated or coated, of a thickness of < 3 mm, not pickled, without patterns in relief | 4% | 2% | 1442.4 | 11% | 0.01 |
| '730429 | Casing and tubing, seamless, of iron or steel, of a kind used in drilling for oil or gas (excluding products of cast iron) | 3% | 1% | 13.2 | 0% | 0.003 |
| '720851 | Flat-rolled products of iron or non-alloy steel, of a width >= 600 mm, not in coils, simply hot-rolled, not clad, plated or coated, of a thickness of > 10 mm, without patterns in relief | 3% | 2% | 215.0 | 2% | 0.04 |
| '720390 | Spongy ferrous products, obtained from molten pig iron by atomisation, iron of a purity of >= 99,94%, in lumps, pellets or similar forms | 3% | 0% | 3.9 | 1% | 0 |
| '732690 | Articles of iron or steel, n.e.s. (excluding cast articles or articles of iron or steel wire) | 3% | 7% | 731.4 | 2% | 330.9 |
| '720836 | Flat-rolled products of iron or non-alloy steel, of a width of >= 600 mm, in coils, simply hot-rolled, not clad, plated or coated, of a thickness of >= 10 mm, not pickled, without patterns in relief | 3% | 0.2% | 71.0 | 4% | 0.003 |
| '721049 | Flat-rolled products of iron or non-alloy steel, of a width of >= 600 mm, hot-rolled or cold-rolled ""cold-reduced"", not corrugated, plated or coated with zinc (excluding electrolytically plated or coated with zinc) | 2% | 3% | 349.6 | 2% | 0.1 |
| '730799 | Tube or pipe fittings, of iron or steel (excluding cast iron or stainless steel products; flanges; threaded elbows, bends and sleeves; butt welding fittings) | 2% | 1% | 97.0 | 2% | 4.8 |
| Total of top 10 commodities | 41% | 3613.2 | 349.3 | |||
| Rest of the commodities under HS code 72 & 73 | 59% | 13,380.4 | 380.7 | |||
| HS 71 - Gems and Jewelry | ||||||
| '710812 | Gold, incl. gold plated with platinum, unwrought, for non-monetary purposes (excluding gold in powder form) | 70% | 38% | 117 | 0.05 | 0 |
| Total of top commodity | 70% | 117 | 0 | |||
| Rest of the commodities under HS code 90 | 30% | 33,779 | 416 | |||
| HS 39 – Plastic and articles thereof | ||||||
| '392690 | Articles of plastics and articles of other materials of heading 3901 to 3914, n.e.s (excluding goods of 9619) | 8% | 10% | 549.4 | 0.8% | 20.9 |
| '390690 | "Acrylic polymers, in primary forms (excluding poly""methyl methacrylate"")" | 5% | 2% | 98.3 | 0.7% | 0.8 |
| '392410 | Tableware and kitchenware, of plastics | 5% | 2% | 140.1 | 1.2% | 1 |
| '391990 | Self-adhesive plates, sheets, film, foil, tape, strip and other flat shapes, of plastics, whether or not in rolls > 20 cm wide (excluding floor, wall and ceiling coverings of heading 3918) | 4% | 2% | 74.5 | 0.5% | 4.4 |
| '390110 | Polyethylene with a specific gravity of < 0,94, in primary forms | 3% | 4% | 537.4 | 2.2% | 9.1 |
| '390190 | Polymers of ethylene, in primary forms (excluding polyethylene and ethylene-vinyl acetate copolymers) | 3% | 1% | 35.2 | 0.6% | 0.06 |
| '392350 | Stoppers, lids, caps and other closures, of plastics | 3% | 1% | 75.9 | 0.9% | 5.4 |
| '390120 | Polyethylene with a specific gravity of >= 0,94, in primary forms | 3% | 5% | 403.3 | 1.4% | 43.1 |
| '391740 | Fittings, e.g. joints, elbows, flanges, of plastics, for tubes, pipes and hoses | 2% | 1% | 34.8 | 0.5% | 0.4 |
| '392190 | Plates, sheets, film, foil and strip, of plastics, reinforced, laminated, supported or similarly combined with other materials, unworked or merely surface-worked or merely cut into squares or rectangles (excluding of cellular plastic; self-adhesive products, floor, wall and ceiling coverings of heading 3918) | 2% | 2% | 309.7 | 2.0% | 218 |
| Total of top commodity | 38% | 2258.6 | 303.2 | |||
| Rest of the commodities under HS code 39 | 62% | 5018.4 | 383.6 | |||
| HS 10 - Cereals | ||||||
| '100630 | Semi-milled or wholly milled rice, whether or not polished or glazed | 43% | 16% | 6980.7 | 34% | 354 |
| '100390 | Barley (excluding seed for sowing) | 25% | 6% | 0.8 | 0.01% | 0.01 |
| Total of top 2 commodities | 68% | 6981.5 | 534.01 | |||
| Rest of the commodities under HS code 10 | 32% | 843.5 | 50.2 | |||
| HS 94 - Furnitures | ||||||
| '940161 | Upholstered seats, with wooden frames (excluding convertible into beds) | 12% | 8% | 17.2 | 0.1% | 0.2 |
| '940360 | Wooden furniture (excluding for offices, kitchens and bedrooms, and seats) | 10% | 10% | 540.3 | 2.1% | 39.9 |
| '940350 | Wooden furniture for bedrooms (excluding seats) | 9% | 5% | 12.3 | 0.1% | 0.2 |
| '940510 | Chandeliers and other electric ceiling or wall lighting fittings (excluding for lighting public open spaces or thoroughfares) | 8% | 7% | 53.5 | 0.3% | 21 |
| '940540 | Electric lamps and lighting fittings, n.e.s. | 7% | 7% | 33.9 | 0.1% | 3.3 |
| '940320 | Chandeliers and other electric ceiling or wall lighting fittings (excluding for lighting public open spaces or thoroughfares) | 7% | 7% | 133.6 | 0.8% | 20.1 |
| '940490 | Articles of bedding and similar furnishing, fitted with springs or stuffed or internally filled with any material or of cellular rubber or plastics (excluding mattress supports, mattresses, sleeping bags, pneumatic or water mattresses and pillows, blankets and covers) | 6% | 4% | 462.3 | 4.0% | 106.5 |
| '940599 | Parts of lamps and lighting fittings, illuminated signs and nameplates and the like, n.e.s. | 6% | 1% | 28.4 | 0.6% | 6.7 |
| '940330 | Wooden furniture for offices (excluding seats) | 3% | 1% | 38.2 | 0.9% | 3.7 |
| Total of top 9 commodities | 68% | 1319.8 | 201.6 | |||
| Rest of the commodities under HS code 94 | 32% | 452.3 | 92.5 | |||
| HS 64 & 42 – Leather and Footwear | ||||||
| '640299 | Footwear with outer soles and uppers of rubber or plastics (excluding covering the ankle or with upper straps or thongs assembled to the sole by means of plugs, waterproof footwear of heading 6401, sports footwear, orthopaedic footwear and toy footwear) | 16% | 9% | 110.9 | 0.5% | 4.4 |
| '640419 | Footwear with outer soles of rubber or plastics and uppers of textile materials (excluding sports footwear, incl. tennis shoes, basketball shoes, gym shoes, training shoes and the like, and toy footwear) | 12% | 11% | 73.1 | 0.3% | 8.7 |
| '420212 | Trunks, suitcases, vanity cases, executive-cases, briefcases, school satchels and similar containers, with outer surface of plastics or textile materials | 12% | 3% | 59.3 | 0.5% | 2.5 |
| '420221 | Handbags, whether or not with shoulder straps, incl. those without handles, with outer surface of leather, composition leather or patent leather | 7% | 7% | 375.4 | 2% | 45.6 |
| '640411 | Sports footwear, incl. tennis shoes, basketball shoes, gym shoes, training shoes and the like, with outer soles of rubber or plastics and uppers of textile materials | 6% | 9% | 148.1 | 1% | 4.5 |
| '420222 | Handbags, whether or not with shoulder straps, incl. those without handles, with outer surface of plastic sheeting or textile materials | 5% | 5% | 304.4 | 2% | 36.2 |
| '640399 | Footwear with outer soles of rubber, plastics or composition leather, with uppers of leather (excluding covering the ankle, incorporating a protective metal toecap, sports footwear, orthopaedic footwear and toy footwear) | 4% | 13% | 284.6 | 1% | 107.8 |
| '420292 | Travelling-bags, insulated food or beverage bags, toilet bags, rucksacks, shopping-bags, map-cases, tool bags, sports bags, jewellery boxes, cutlery cases, binocular cases, camera cases, musical instrument cases, gun cases, holsters and similar containers, with outer surface of plastic sheeting or textile materials (excluding trunks, briefcases, school satchels and similar containers, handbags and articles carried in the pocket or handbag) | 4% | 8% | 10.9 | 0.1% | 4.2 |
| '420211 | Trunks, suitcases, vanity cases, executive-cases, briefcases, school satchels and similar containers, with outer surface of leather, composition leather or patent leather | 4% | 0% | 64.5 | 5% | 11.3 |
| Total of top 9 commodities | 69% | 1431.2 | 225.2 | |||
| Rest of the commodities under HS code 64 & 42 | 31% | 3382.9 | 958.4 | |||
| HS 57 – Carpets and other floor coverings | ||||||
| '570242 | Carpets and other floor coverings, of man-made textile materials, woven, not tufted or flocked, of pile construction, made up (excluding Kelem, Schumacks, Karamanie and similar hand-woven rugs) | 43% | 18% | 37.3 | 1% | 3.2 |
| '570330 | Carpets and other floor coverings, of man-made textile materials, tufted ""needle punched"", whether or not made up (excluding those of nylon or other polyamides) | 29% | 21% | 142.6 | 4% | 13.5 |
| Total of top 2 commodities | 71% | 179.9 | 16.7 | |||
| Rest of the commodities under HS code 57 | 29% | 1540 | 590.1 | |||
| HS 70 - Glass and Glassware | ||||||
| '701090 | Carboys, bottles, flasks, jars, pots, phials and other containers, of glass, of a kind used for the commercial conveyance or packing of goods, and preserving jars, of glass (excluding ampoules, glass inners for containers, with vacuum insulation, perfume atomizers, flasks, bottles etc. for atomizers) | 10% | 14% | 229.0 | 2% | 11.3 |
| '701310 | Glassware of glass ceramics, of a kind used for table, kitchen, toilet, office, indoor decoration or similar purposes | 9% | 0.4% | 1.7 | 1% | 0.8 |
| '701990 | Glass fibres and articles thereof, n.e.s. | 8% | 4% | 36.1 | 1% | 0.61 |
| '701939 | Webs, mattresses, boards and similar nonwoven products, of glass fibres (excluding mats and thin sheets ""voiles"") | 8% | 3% | 8.8 | 0% | 0.1 |
| '701912 | Rovings of glass fibres | 6% | 2% | 12.8 | 1% | 0 |
| '700992 | Glass mirrors, framed (excluding rear-view mirrors for vehicles, optical mirrors, optically processed, and mirrors of an age of > 100 years) | 4% | 2% | 32.3 | 2% | 16.8 |
| '700521 | Float glass and surface ground glass, in sheets, coloured throughout the mass ""body tinted"", opacified, flashed or merely surface ground, but not otherwise worked (excluding wired glass or glass having an absorbent, reflecting or non-reflecting layer) | 4% | 1% | 0.4 | 0% | 0 |
| '701349 | Glassware for table or kitchen purposes (excluding glass having a linear coefficient of expansion <= 5 x 10 -6 per kelvin within a temperature range of 0°C to 300°C, glassware of glass ceramics or lead crystaldrinking glasses, glass preserving jars ""sterilising jars"", vacuum flasks and other vacuum vessels) | 3% | 3% | 14.6 | 1% | 1.3 |
| '701919 | "Glass fibre cakes ""textile cakes"" and chopped glass fibre strands of a length >50mm" | 3% | 1% | 2.2 | 0% | 0.01 |
| '700800 | Multiple-walled insulating units of glass | 3% | 2% | 7.8 | 0% | 0.5 |
| Total of top 10 commodities | 59% | 345.6 | 31.4 | |||
| Rest of the commodities under HS code 70 | 41% | 510 | 175.5 | |||
